Search This Blog

Showing posts with label love your data week. Show all posts

Tuesday, February 14, 2017

Love Your Data Week: Day 2 - Documenting, Describing, Defining

Today’s topic is “Documenting, Describing, Defining”, and so we’re taking the opportunity to highlight a platform that can help streamline those processes.

We are happy to announce that UW has become an Affiliate of the Open Science Framework! UW staff, students, and researchers can now create OSF accounts using their NetID through the “Login through your institution” pointer on the Sign Up page. Not only is OSF a fantastic tool for data management and data sharing, it’s also a tremendous resource for keeping organized throughout the research process.

In a nutshell, OSF is like Github for workflows, except it can also serve as command central for all of the bits and pieces of your work that you’ve spread over Amazon S3, Github, Google Drive, Mendeley, and elsewhere.  It is an open source, cloud-based project management platform, designed to help teams collaborate in one centralized location. Teams can connect third-party services that they already use for both storage and reference management directly to the OSF workspace. With version control, persistent URLs, and DOI registration, OSF is a powerful tool for enabling reproducible research practices.

Anyone can create an OSF account, so collaborating with people outside your institution is easy. You have fine-grain control over who has access to your project – or even individual components of your project. So OSF can serve as both the sharing platform you use for externally-focused materials like data sets and preprints, but also the secure workspace you use to keep track of internal materials like analysis protocols and manuscript drafts. (A caveat: OSF is not HIPAA compliant, so you shouldn’t upload or link to your sensitive data.)
OSF is also a great tool for teaching reproducibility, allowing instructors to not only guide the shape of their students’ projects, but also to keep tabs on how successful students are in their workflow and data management efforts. If you’d like more information on how to use OSF in the classroom, this is an excellent presentation.
We are big fans of OSF here in Research Data Services, and we encourage you to check it out. This only scratches the surface of OSF’s capabilities, so if you’d like to learn more you can visit their extensive Help section, or contact us at libdata@uw.edu.

Monday, February 13, 2017

Love Your Data Week: Day 1

Welcome to Love Your Data Week 2017! Organized by Research Data Specialists from several academic institutions, Love Your Data Week aims "to raise awareness and build a community to engage on topics related to research data management, sharing, preservation, reuse, and library-based research data services." Each day we will highlight a different aspect of research data management. Follow our blog, check our Twitter page, and look for the hashtags #LYD17 and #loveyourdata for new and interesting data-related insights all week!


Today's Topic: Defining Data Quality

Today we are highlighting the work of a University of Washington research lab, to demonstrate how one group of researchers define data quality.

Loma, Kaeli, and Jorge from the Avian Conservation Laboratory in the UW's School of Environmental and Forest Sciences kindly agreed to answer a few questions about data quality in their field of research. Let us know your experiences with data quality by tweeting with the hashtag #LYD17 to @UWLibsData.

Provide a brief introduction to yourself and your lab/team:

Kaeli: "I study the behavior of crows around dead crows (ethology/thanatology). Most other people in my lab also work on birds, but our individual studies, areas of research and methodologies vary greatly."

Jorge: "I'm an international student from Chile working on the Avian Conservation Lab of John Marzluff at the School of Environmental and Forest Sciences."

What does data look like in your area of research?

Kaeli: "My data is generally measurements of time (x seconds spent doing a particular thing or in a particular place) binary measurements (did or didn't something occur) and count data such as the number of birds present or the number of times an action occurred."

Jorge: "I have many different kinds of data. I have spatial data that includes locations and attributes of certain aspects of what individual animals I studied did on such places. I also have data on abundance of different bird species on the greater Seattle area."

The message for today is: "Data quality is the degree to which data meets the purposes and requirements of its use. Depending on the uses, good quality data may refer to complete, accurate, credible, consistent or “good enough” data." How would you define quality data in your field? Are there any standards for assuring data quality? How do you and your fellow researchers distinguish between quality data and questionable data?

Loma: "I've never thought of this before. I would assume that directly observable quantitative data would be considered better quality than qualitative data."

Kaeli: "This is actually a really hard question. It would probably be really difficult for me to just look at someone's data and determine if it was of poor quality. Perhaps if I was looking at their raw data sheets and noticed a lot of missing information, but otherwise the devil is in the methodological approach not necessarily the data itself. So I would question the data if say all but two data points were collected at a very specific time of day. Any standards for collecting quality data really come from both your field of study and what statistical methods you plan to use."

Jorge: "For me, quality data is representative and unbiased. The typical standards have to do with the quantity of data to be able to perform relevant statistical tests, and the training of the people that collected the data."

"For me, it's not intuitive to detect bad data. Sometimes you see patterns emerge that don't match what is expected, and that may help, but otherwise it is not that easy."

How did you decide what to measure and how to gather the data in your research?

Loma: "I created a hypothesis for the question I was trying to answer, then thought about what I could measure that would allow me to refute or fail to refute that hypothesis. For example, I'm currently trying to figure out what certain vocalizations mean to a crow, so I measured a number of behaviors that are indicative of agitation, fear, aggression, and curiosity. That way, I can compare how often a crow gives those behaviors both before and after I play a certain call through a loudspeaker."

Kaeli: "I mostly make it up as I go along. Which is kind of a joke and kind of not. Often I design and experiment based on what I think the most meaningful or robust measure of my question will be, but then once I get into the field I find out that doing it that way is actually impractical or impossible so I need to change it. So often in wildlife studies the answer to that question is that we try our best to guess what will work but ultimately we're at the mercy of our study animal and the elements."

Jorge: "I asked what would it be relevant to measure for the biological questions I was going to ask and what was it feasible to collect, given my logistical and budgetary constraints."

Do you have processes in place for maintaining your data for future use and sharing?

Loma: "I have my data backed up on two hard drives and the department cloud storage, and I'm willing to share it to anyone who asks so long as they convince me that I'd be included as an author/contributor on whatever they're working on."

Kaeli: "Yes but I don't really use them, [to be honest]. I back up all my data on my computer, 3 hard drives and in dropbox. We're supposed to also back them up on our lab's server but I hardly ever do this!"

Jorge: "I keep my data on several places (like the data sheets where I collected it, and different hard drives) to ensure it's safety. I'm not planning on sharing my data at this time."

Thank you Loma, Kaeli, and Jorge for sharing your experience with data quality. We wish you the best of luck in your research!

Friday, February 12, 2016

Love Your Data Week, Day 5: Transform, Extend, Reuse

Today we're wrapping up Love Your Data Week by addressing open data and data sharing. This blog post from the University of Michigan Libraries includes a list of ways to share your data. Also worthy are these stories about how data are shared and reused by others:
You can also check out Nine Simple Ways to Make it Easier to (re)Use Your Data. And as always, if you're looking for ways to make your data more sharable, contact the UW Libraries Data Services Team!

Thursday, February 11, 2016

Love Your Data Week, Day 4: Data Citation

As stated on the Love Your Data site: "Data are becoming valued scholarly products instead of a byproduct of the research process. Federal funding agencies and publishers are encouraging, and sometimes requiring, researchers to share data that have been created with public funds. The benefit to researchers is that sharing your data can increase the impact of your work, lead to new collaborations or projects, enables verification of your published results, provides credit to you as the creator, and provides great resources for education and training. Data sharing also benefits the greater scientific community, funders,the public by encouraging scientific inquiry and debate, increases transparency, reduces the cost of duplicating data, and enables informed public policy."

Looking for some pointers on how to share your data? If you're at the University of Washington, you may already be sharing papers in the ResearchWorks Archive. The Libraries is in the process of updating the archive and working out how best to support data archiving on campus, so if you have data you want to preserve in the long-term, contact us to see if we can use your data as a test case as we build a new data repository.

If you're interested in learning more about how data citation impacts research reputation, Robin Chin-Roemer has a new book called Meaningful Metrics that serves as a guide to impact, bibliometrics, altmetrics as well as a few other topics. 

For today's activity, consider these "good practice" tips:

  • share your data upon publication
  • share your data in an open, accessible and machine readable format
  • deposit your data in your institution's repository to enable long-term preservation
  • license your data so people know what they can do with it
  • tell people how to cite your data 
  • when choosing a repository, ask about the support for tracking its use. Is a handle or DOI provided? Can the depositor see how many views and downloads the data has? Is the cite indexed by google, google scholar, the data citation index?


Wednesday, February 10, 2016

Love Your Data Week, Day 3: Help Your Future Self

By Help Your Future Self, we mean Write It Down: document, document, document! Your documentation provides crucial context for your data. So whatever your preferred method of record keeping is, today is the day to make it a little bit better! Some general strategies that work for any format:

  • Be clear, concise, and consistent.
  • Write legibly.
  • Number pages.
  • Date everything, use a standard format (ex: YYYYMMDD).
  • Try to organize information in a logical and consistent way.
  • Define your assumptions, parameters, codes, abbreviations, etc.
  • If documentation is scattered across more than one place or file (e.g., protocols & lab notebook), remind yourself of the file names and where those files are located.
  • Review your notes regularly and keep them current.
  • Keep all of your notes for at least 7 years after the project is completed.
Things to avoid:

  • Writing illegibly.
  • Using abbreviations or codes that aren’t defined.
  • Using abbreviations or codes inconsistently.
  • Forgetting to jot down what was unusual or what went wrong. This is usually the most important type of information when it comes to analysis and write up!
Today's Activity: If your documentation could be better, try out some of these strategies and tools:


Take a few minutes to think about how you document your data. What’s missing? Where are the gaps? Can you set up some processes to make this part of the work easier?

Using WinMerge to Manage Files and Folders

Post by Greta Pittenger, Data Services Specialist and MLIS student at UW iSchool

WinMerge is an open source tool for Windows that compares and (of course) merges files and folders. It uses side-by-side comparison windows and can create backups of files before you save what’s been merged. It also works integrated with some versioning applications and can create patch files and resolve conflict files.

I downloaded WinMerge at work and at home to give it a try. Confession: I have files from different projects stored in totally different, not multiple, places - bad! To try out WinMerge’s compare tool, I managed to find two folders from the same project that in theory should be the same - one on a department server and the other in Dropbox.

wesbiteFolderComparison.PNG

Looks pretty good! There are a few Thumbs.db (thumbnails) files that are either not identical or only in one folder and not the other - not something I’m too worried about. Looks like the only other file that is different is Share_Publish.docx. Double clicking on that line will bring the two files into their own file-comparison tab.

personasFileComparison.PNG

Wuh oh. Encoding issues… I’ll have to dig deeper into that. Suffice to say, I checked the files in MS Word and they looked identical visually, but noted in WinMerge that the most recent edit dates are different. Further investigation with the WinMerge manual is required, but I’ll save that  for another day.

To get a better idea of what the file comparison looks like when it’s most helpful, I looked at two XML files. Often, I’ll save an XML file just before trying something new out, and then save the changed file as a new version. This way, I can always go back to the old version if something in the new lines aren’t working the way I expect.

Screenshot (11).png

The differences (or, difference, in this case) show up in yellow upon first opening.

Screenshot (12).png

Clicking the Next Difference arrow takes me to the next, and only, difference for these files. The file on the right just has some added information within the brackets. I could merge these lines, or merge the entire files if more lines were different. I’ll leave them for now though.

Notice that the space taken up by the extra text on the right is represented on the left by a gray line. This keeps the rest of the documents lined up for easy side-by-side comparison. Here’s another quick example:

Screenshot (9).png

Again, the only difference is added text. The scroll bar in the Location Pane on the left side will show where all the differences in a document are, with the added gray space. The Diff Pane on the bottom brings up the current difference you are viewing to more completely see the lines.

This is a great tool for backing up files (note to self) and making sure most recent backups are up to date. Even if you don’t merge files, it can be used to tell you if you need to save a new version after changes have been made. One of the most useful things, in my mind, is the automatic addition of WinMerge to drop-down menus when right-clicking on files, as displayed below:

Screenshot (10).png

So simple.

WinMerge can be downloaded for free. Make sure to take a look at the Quick Tour to get some more tips and training on ways it can be used.

Tuesday, February 9, 2016

Using Bulk Rename Utility in a Digital Preservation Workflow

Post by Liz Bedford, Data Services Project Librarian

My first experience getting into the nuts and bolts of digital preservation has been working with the Preservation department here at UW Libraries to remediate digitized versions of rare books for uploading into the HathiTrust Digital Library. Each page gets its own file, so for any book I’m working on, we’re talking about 100-500 TIFFs and JPEGs.  It’s a finicky process, because Hathi has extremely high standards for the material they accept into the collection. Great for future readers! But let’s just say that if it weren’t for automation, there’s no way I’d still be able to type coherently by the end of the day.

One of the tools I’ve come to rely on is Bulk Rename Utility, an open-source file rename utility for Windows. It’s pretty much effortless to set up, has a straightforward and intuitive GUI, and offers a wide variety of ways to play with file names. I predominantly use the Numbering and Extension rename options, but that barely scratches the surface of the functionality.

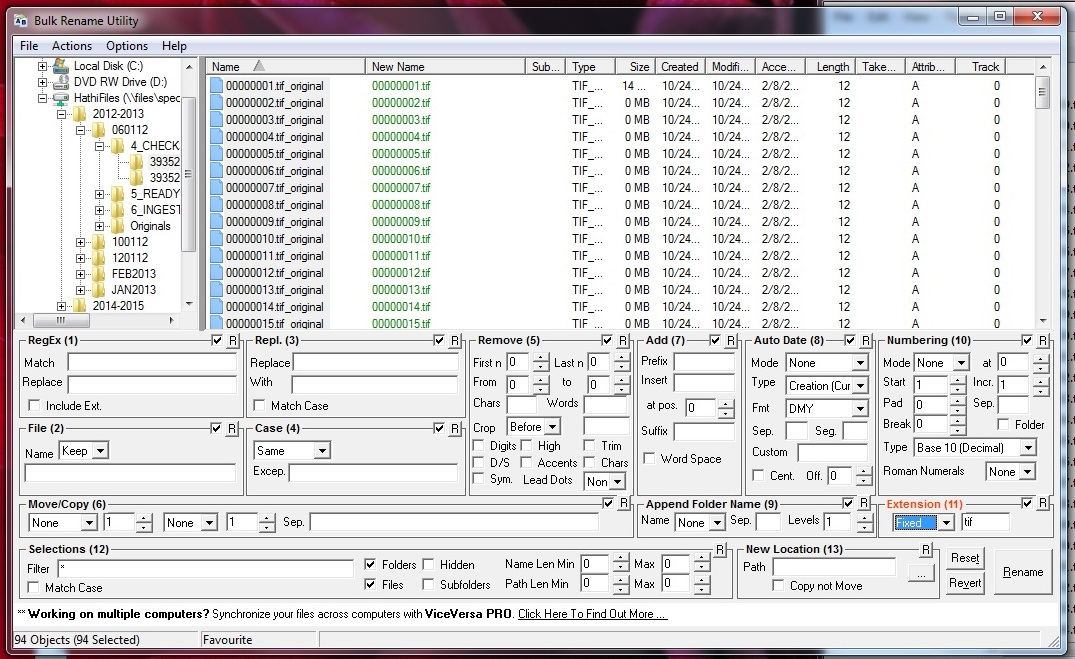
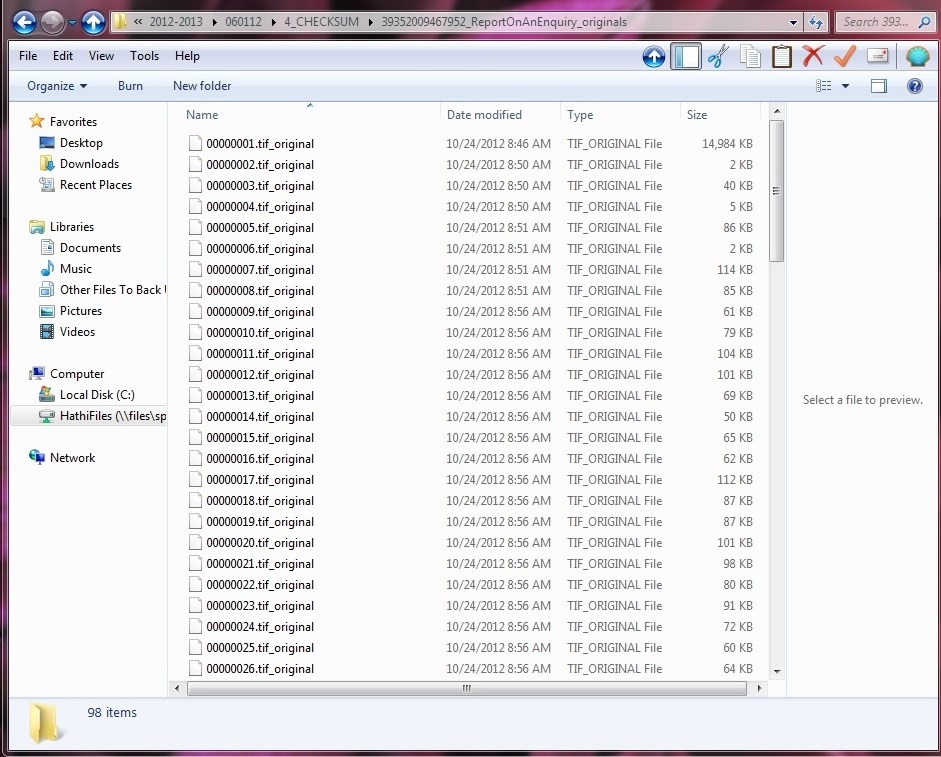
Let’s look at a recent example. A book I was working on was comprised of what I knew to be well-formed TIFFs. But I was unable to open the files, because at some point the file extension was changed from .tif to .tif_original. After opening Bulk Rename Utility, I navigated to my folder using the left sidebar. The first column shows the current file name, while the second shows what the new name will be with the options you’ve selected below. After using Ctrl + Shift to highlight all of my files, I used the dropdown menu in the Extension option (number 11) to indicate that I wanted my extensions to be “Fixed” as tif.

fixed_extension.jpg

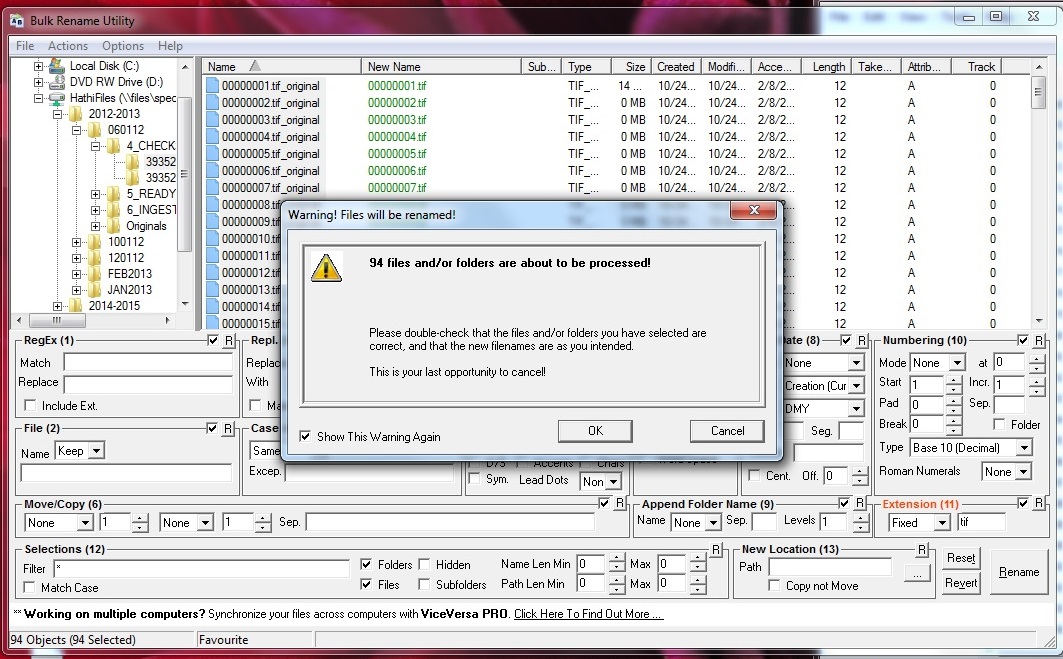
After hitting ‘Rename,’ Bulk Rename Utility flashes an ‘are you sure’ warning, which, based on experience, I do appreciate:

warning.jpg

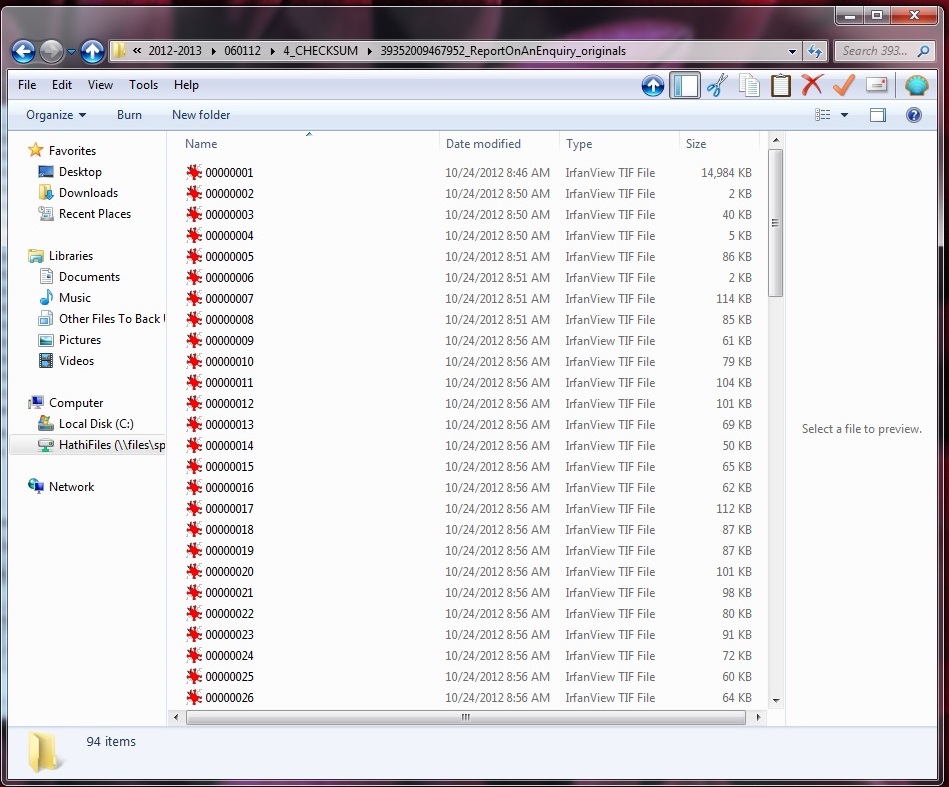
Three seconds later, my TIFFs are TIFFs, and all is right with the world. (Aka Windows will now let me continue to do my job.)
tif_original.jpgvsirfan.jpg

As I said, I’ve also used Bulk Rename Utility to re-number my files in a similarly easy process. I’m sure I’ll find other applications for the software  - I’m particularly curious about the functionality that lets you insert new names from an imported text file - but for now, I’m thrilled it’s on my digital preservation toolbelt.

Love Your Data Week, Day 2: Data Organization

phd101212s_finaldocToday the focus of Love Your Data Week is data organization. We'll have two posts today, the first on the topic of naming, the second reviewing Bulk Rename Utility.

So, first: Data librarians at Penn State have written two blog posts on The Art of Naming Things, one of which focuses on the practice of creating logical element names in a dataset and functions in your code (among other things). The second post deals with naming schemes for files and directories.

Part of #LYD16 is a daily activity designed to both illustrate the concepts being discussed, and to give data users a place to start. Today's activity is to come up with a folder structure and/or naming plan. Tips from #LYD16 folks are:

If you don’t already have a folder structure and/or file naming plan, come up with one and share it. Some good practices for naming files are described below:

  • Be Clear, Concise, Consistent, and Correct
  • Make it meaningful (to you and anyone else who is working on the project) 
  • Provide context so it will still be a unique file and people will be able to recognize what it is if moved to another location.
  • For sequential numbering, use leading zeros.
    • For example, a sequence of 1-10 should be numbered 01-10; a sequence of 1-100 should be numbered 001-010-100.
  • Do not use special characters: & , * % # ; * ( ) ! @$ ^ ~ ‘ { } [ ] ? < >
    • Some people like to use a dash ( – ) to separate words
    • Others like to separate words by capitalizing the first letter of each (e.g., DST_FileNamingScheme_20151216)
  • Dates should be formatted like this: YYYYMMDD (e.g., 20150209)
    • Put dates at the beginning or the end of your files, not in the middle, to make it easy to sort files by name
    • OK: DST_FileNamingScheme_20151216
    • OK: 20151216_DST_FileNamingScheme
    • AVOID: DST_20151216_FileNamingScheme
  • Use only one period and before the file extension (e.g., name_paper.doc NOT name.paper.doc OR name_paper..doc)

There are generally two approaches to folder structures. Filing, or using a hierarchical folder structure. The other approach is piling, which relies on fewer folders and uses the search, sort, and tagging functions of your operating system or cloud storage tools like Box.
DSP_FolderStructure-Ex2DSP_FolderStructure-Ex1

Monday, February 8, 2016

Love Your Data Week, Day 1: Keep Your Data Safe

Welcome to Day 1 of Love Your Data Week! We're going to kick off the week by talking about the 3-2-1 rule:
  • Keep 3 copies of any important file (1 primary, 2 backup copies)
  • Store files on at least 2 different media types (e.g., 1 copy on an internal hard drive and a second in a secure cloud account or an external hard drive)
  • Keep at least 1 copy offsite (i.e., not at your home or in the campus lab)
Things to Avoid: 
  • Storing the only copy of your data on your laptop or flash drive
  • Storing critical data on an unencrypted laptop or flash drive
  • Saving copies of your files haphazardly across 3 or 4 places
  • Sharing the password to your laptop or cloud storage account

TODAY’S ACTIVITY

Data snapshots or data locks are great for tracking your data from collection through analysis and write up. Librarians call this provenance, and it can be really important. Errors are inevitable. Data snapshots can save you lots of time when you make a mistake in cleaning or coding your data. Taking periodic snapshots of your data, especially before the next phase begins (collection or processing or analysis) can keep you from losing crucial data and time if you need to make corrections. These snapshots then get archived somewhere safe (not where you store active files) just in case you need them. If something should go wrong, copy the files you need back to your active storage location, keeping the original snapshot in your archival location. For a 5-year longitudinal study, you might take snapshots every quarter. If you will be collecting all the data for your study in a 2-week period, you will want to take snapshots more often, probably every day. How much data can you afford to lose? Oh, and (almost) always keep the raw data! The only time when you might not is it’s easier and less expensive to recreate the data than keep it around.
Instructions: Draw a quick workflow diagram of the data lifecycle for your project (check out our examples on Instagram and Pinterest). Think about when major data transformations happen in your workflow. Taking a snapshot of your data just before and after the transformation can save you from heartache and confusion if something goes wrong.

TELL US 

Where do you store your data? Why did you choose those platform(s), locations, or devices?
Twitter: #LYD16 or @IandPangurBan
Instagram: #LYD16
Facebook: #LYD16

RESOURCES

Check out the resource board & the changing face of data on Pinterest, or email the UW Libraries Data Services Team with questions.

Wednesday, January 13, 2016

Just in time for Valentine's Day: Love Your Data Week!

The University of Washington Libraries will be participating in Love Your Data week, a nationwide event designed to raise awareness about research data management, sharing, and preservation, along with the support and resources available at our university. We believe research data are the foundation of the scholarly record and crucial for advancing knowledge of the world around us. Visit this blog during the week of February 8, 2016: each day will we will share daily tips and tricks for managing research data, stories (both success and horror!), examples and resources. 

You can also join the national conversation on Twitter via #LYD16. The main site for Love Your Data Week will also be a good source of information for the week, and you can see other participating institutions listed there as well.